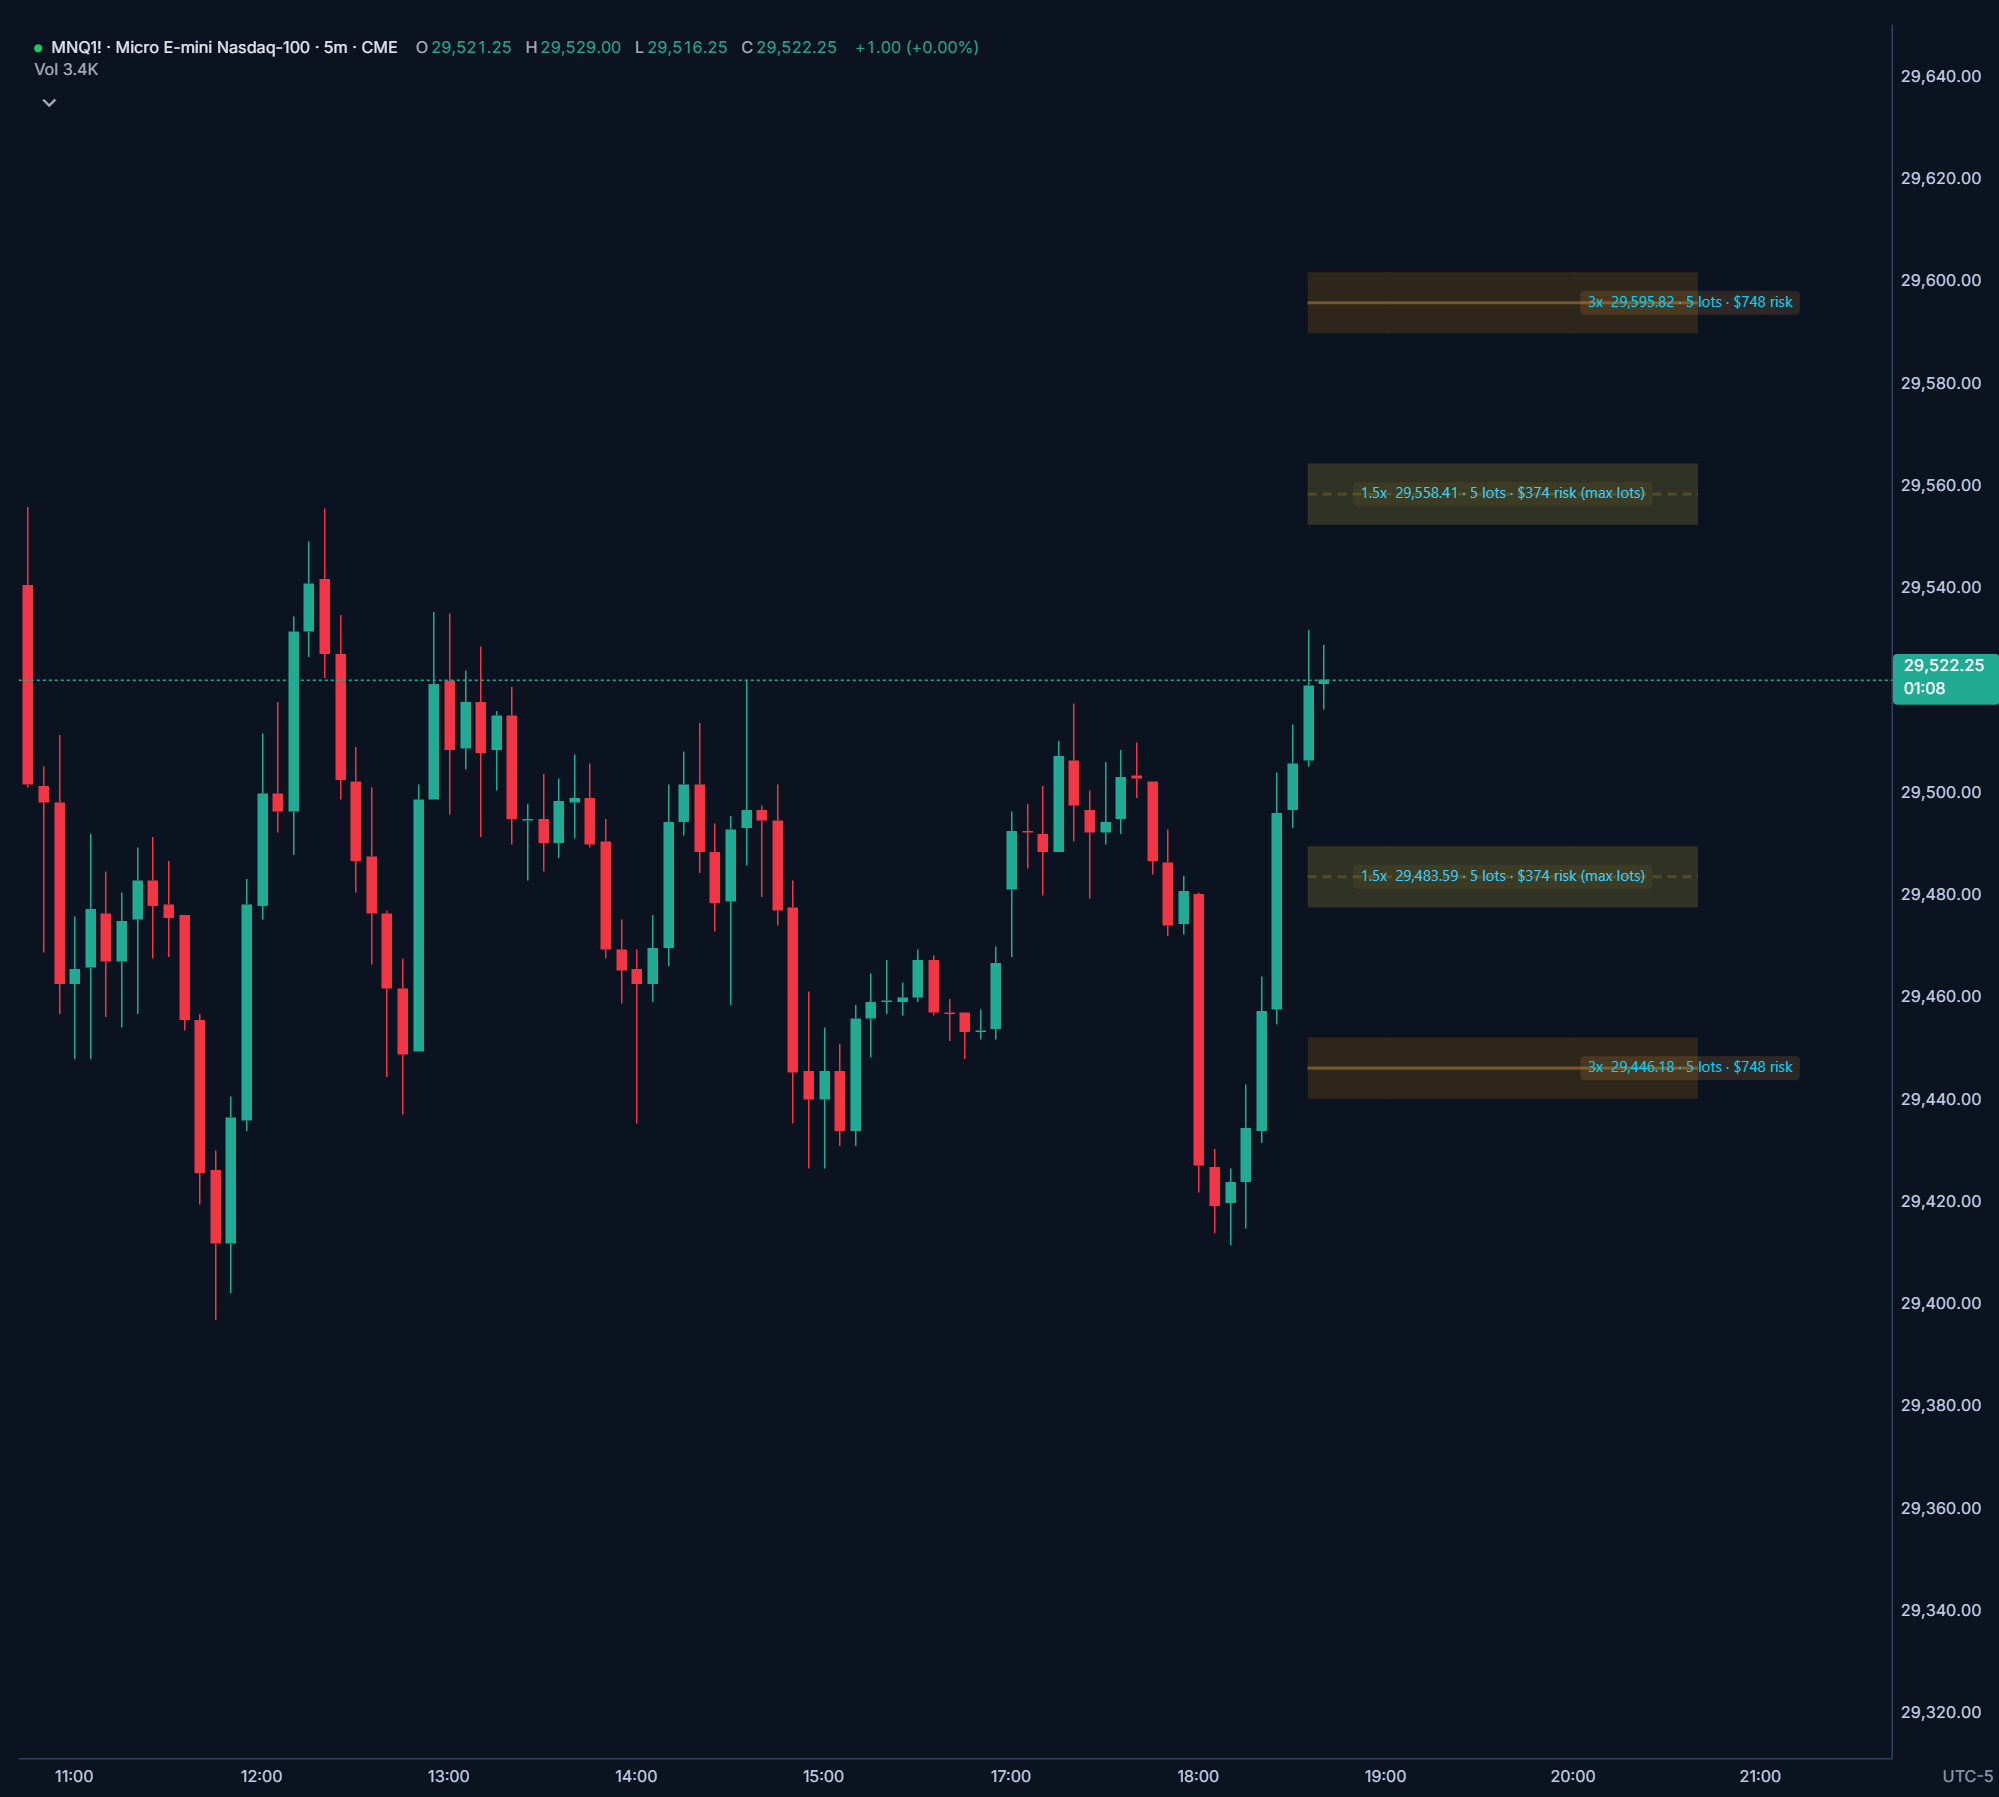
A fixed 10-point stop is tight on a fast day and loose on a slow one. A stop measured in ATR stays the same size relative to how much the market is actually moving.
ATR, the average true range, is the average size of the last 10 candles, gaps included. The study takes the close of the last finished candle and draws a level 1.5× ATR and 3× ATR away on each side. On a long, the lines below are stops; on a short, the lines above.
Each label then answers the question that comes next: how big can I trade with my stop there? The chart tells the study whether you're on futures or perps, so the sizing switches by itself.
Perps: coins = max risk ÷ (stop distance + entry and exit fees)
Futures sizes round down to whole contracts and stop at your max contracts. Perps sizes include taker fees on the way in and out, so the dollar loss at the stop matches your max risk.