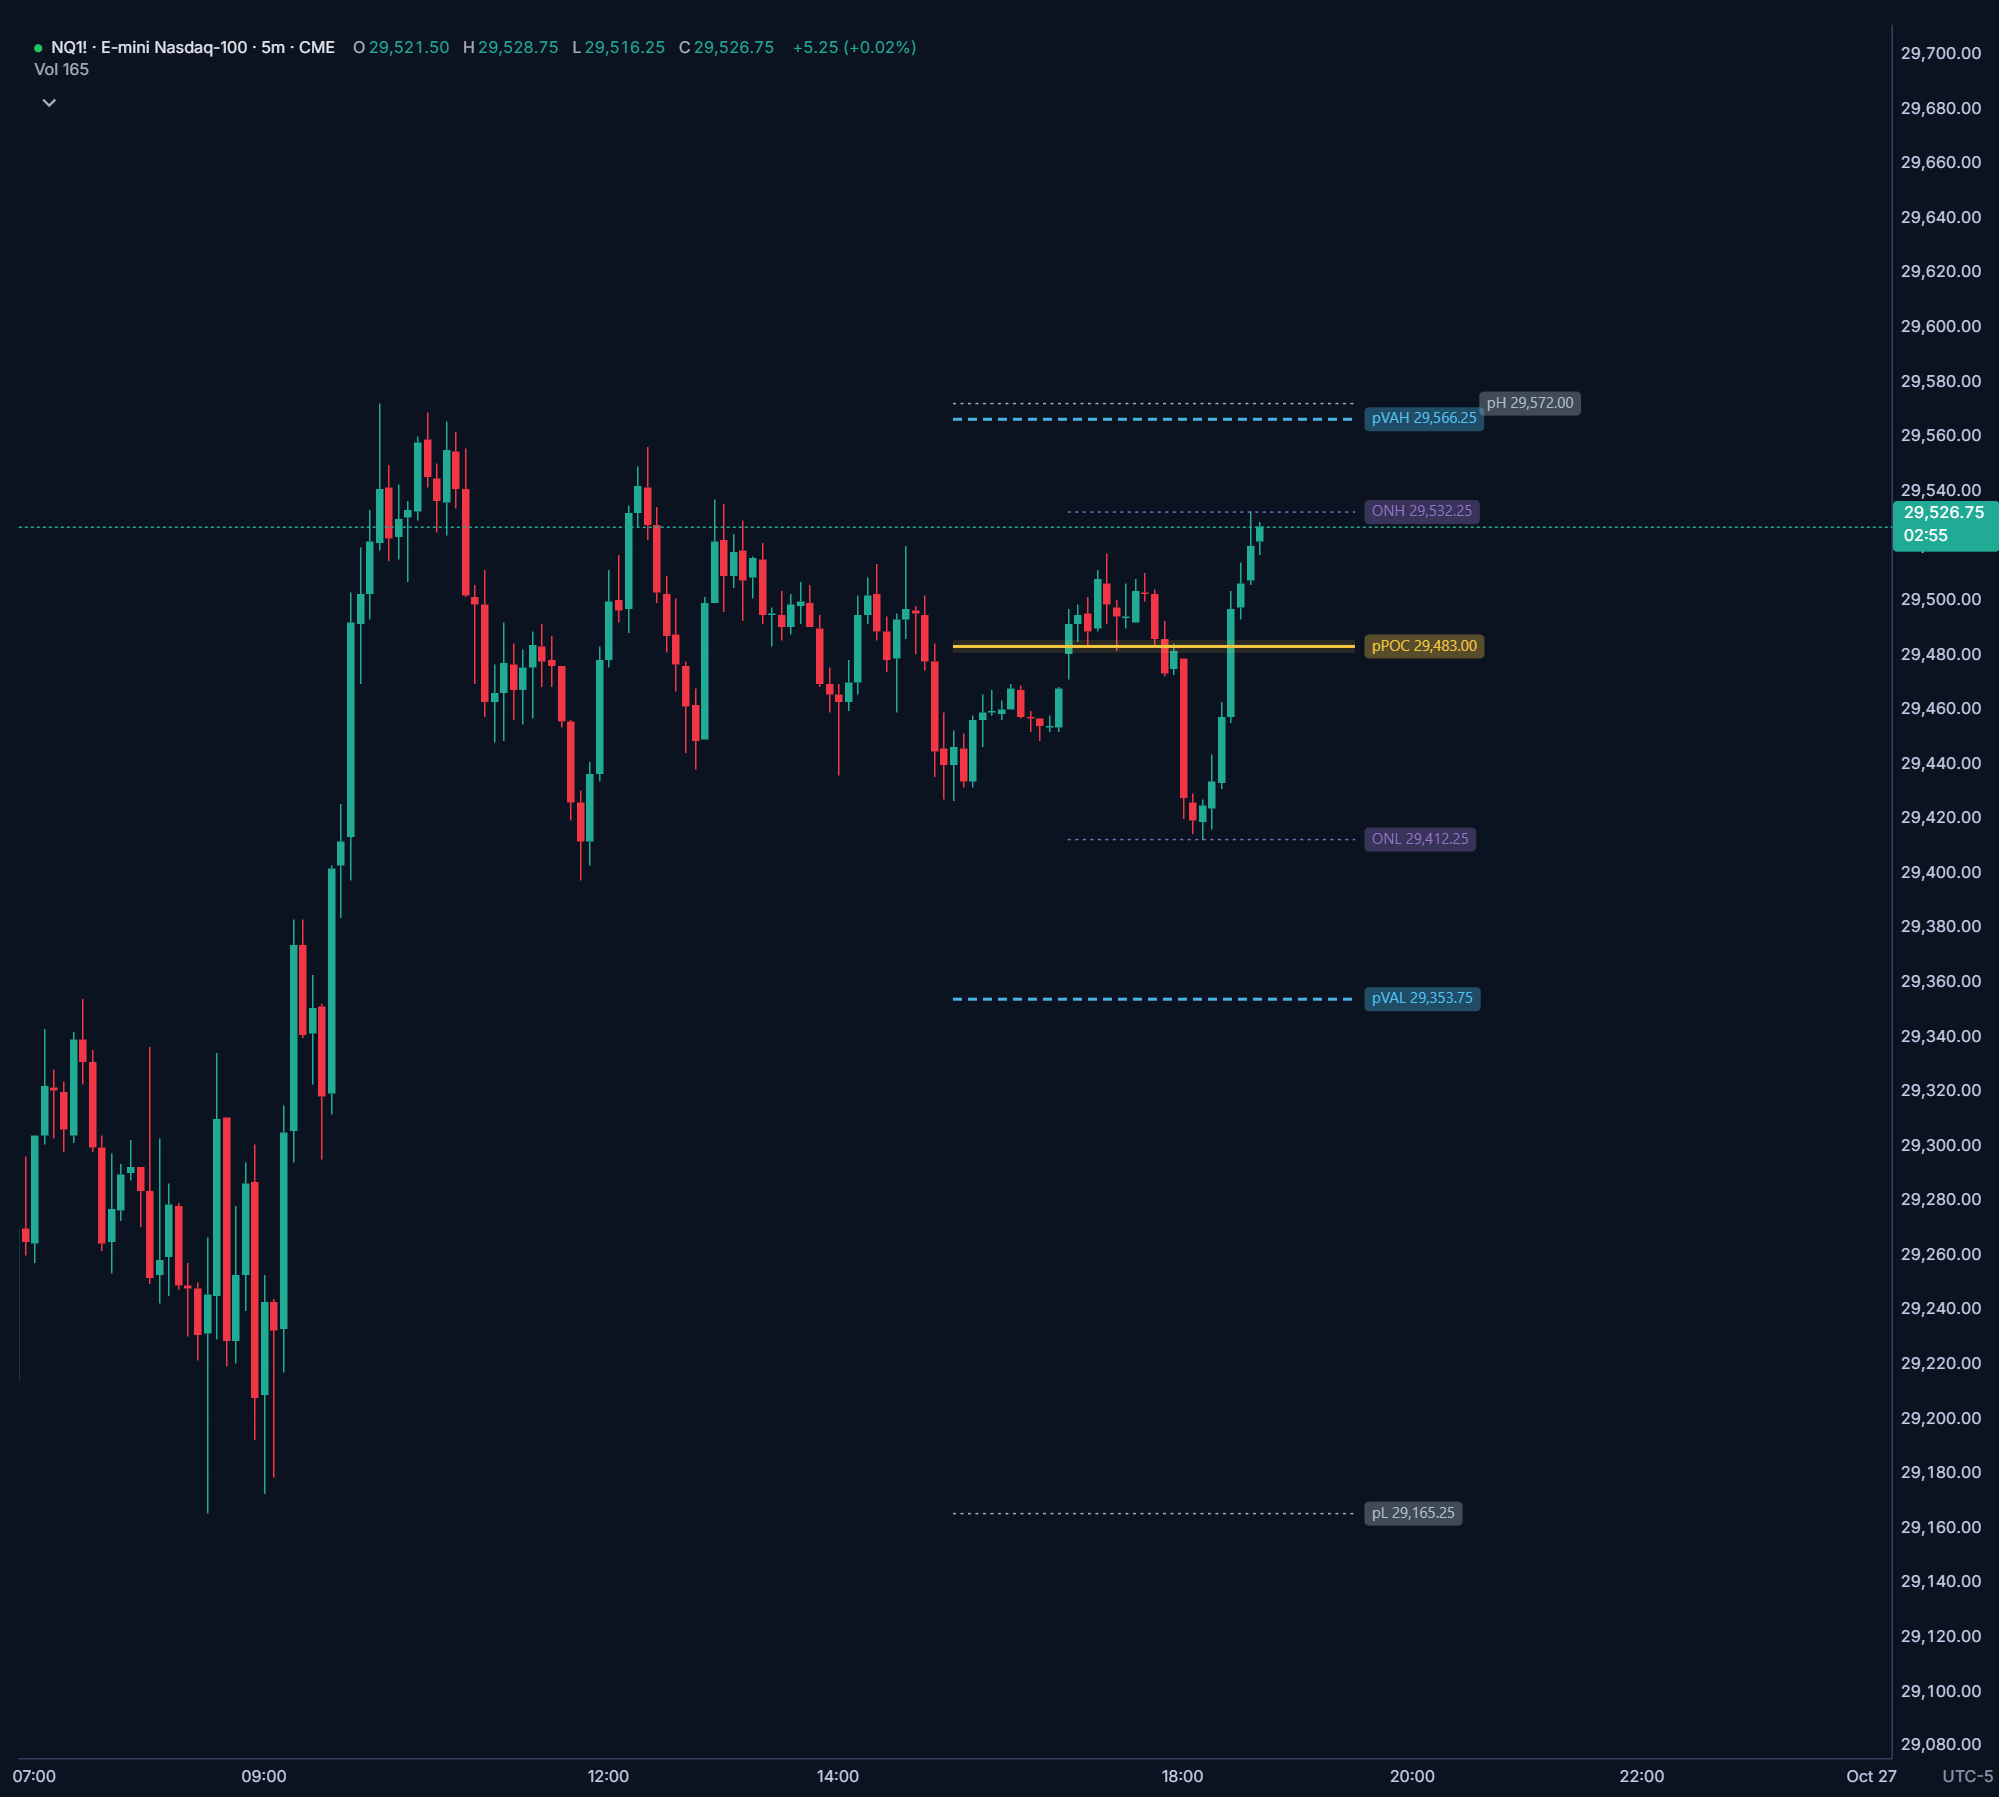
Where the market spent the most time is where buyers and sellers agreed on value. Where it moved fast, or stalled without follow-through, the auction is unfinished, and markets tend to come back to finish it.
Salti MGI builds a profile of each session from your chart's bars. The session is split into 30-minute TPO periods, and prices are grouped into rows. Each period that traded at a row counts once there, so a row's count is how many periods spent time at that price.
The busiest row is the POC, the point of control. The value area grows out from the POC, adding the busier rows above or below, until it holds 70% of the session's time. Its edges are the VAH and VAL. You can build the value area from volume instead of time.
Hyperprop gives scripts bars, not ticks, so a bar counts at every price from its low to its high. On charts of 5 minutes or less that's close to a true TPO profile; on 15- and 30-minute charts the big bars make rows a little wider.